Use TPTP in Eclipse

This is a little Tutorials about how to install TPTP in Eclipse.
What is TPTP?
Eclipse Test and Performance Tools Platform (TPTP) is a Eclipse project that contains tools for performance-testing, application profiling and testing an application.
More Information? http://www.eclipse.org/tptp/
1.Suppose you are not have TPTP ready in you Eclipse IDE.
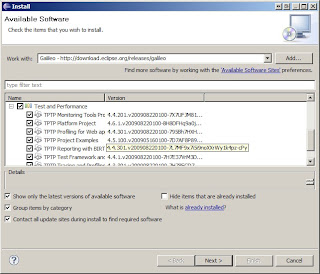
Go to help>Install new Software...
select "Galileo - http://download.eclipse.org/releases/galileo" in the pop out window and select "Test and Performance" sub-choice. In "Test and Performance" I select all of them.

Click Next and follow the screen to install the TPTP for your Eclipse IDE.
2. Open the project which you want to profile in Eclipse.
3. Right click the main class of your Java project, and choose "Profile as>Profile "Configurations...", if you are running for the first time.


In the monitor panel of the pop out window, select "Execute Time Analysis".
Then click"Profile"
"Switch to the perspective "Profiling and Logging" if you are asked.
Here you can see the report based on your selection."
4. If you are not running the profile for the first time, choose "Java
Application" in stead.
5. After running the program will take you to the result screen.

How to use jRat in Eclipse

jrat and Eclipse


1. Donwload jrat from:http://jrat.sourceforge.net/
Extract the download file into c:\jRat
2. Open the project which you want to profile use jRat in Eclipse
in this case, I am using OysterDb1.5 as example.


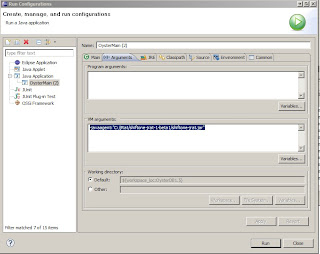
3. From the drop doqn list Run>Run Configurations.....
In the field of VM arguments input the following:
-javaagent:"C:/jRat/shiftone-jrat-1-beta1/shiftone-jrat.jar"
click APPLY


4.Run your project as usual. when you run the program, you will see a whole bunch of output from the console regarding jRat, that means you run jRat successfully.

5. After finish running your project, go to the project folder: In this case should be OystrDB1.5 and you will se folder named "jrat.output". This is the folder contains the jRat outputs.
6. Run java -jar shiftone-jrat.jar from command Promt.


You will open a window "Jrat Desktop". select file>Open and then point to the "jrat.output". Open the output file and see the statistics results.

Remote Connect To Windows Server 2008 Data Center From Mac

Microsoft has Remote Desktop mac edition, but when you use it to connect your Windows Server 2008, you may encounter such problem:
"You were disconnected from the Windows-based computer because of problems during the licensing protocol."

Here is one solution, instead of using this program you can use
CoRD, which is free.


You can download CoRD from Sourceforge.

Datatable static image not found on the server

When you use ```datatables.min.css``` and ```datatables.min.js``` locally, instead of datatables CDN, you may have encountered that ```sort...